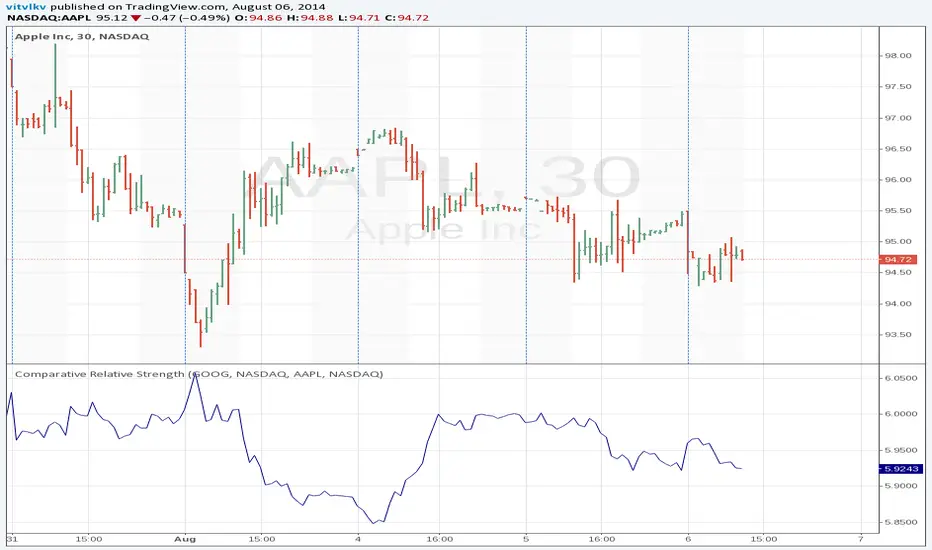
Comparative Relative StrengthThe Comparative Relative Strength indicator is calculated by dividing one security's price by a second security's price (the "base" security). The result of this division is the ratio, or relationship, between the two securities.
Pesquisar nos scripts por "relative strength"
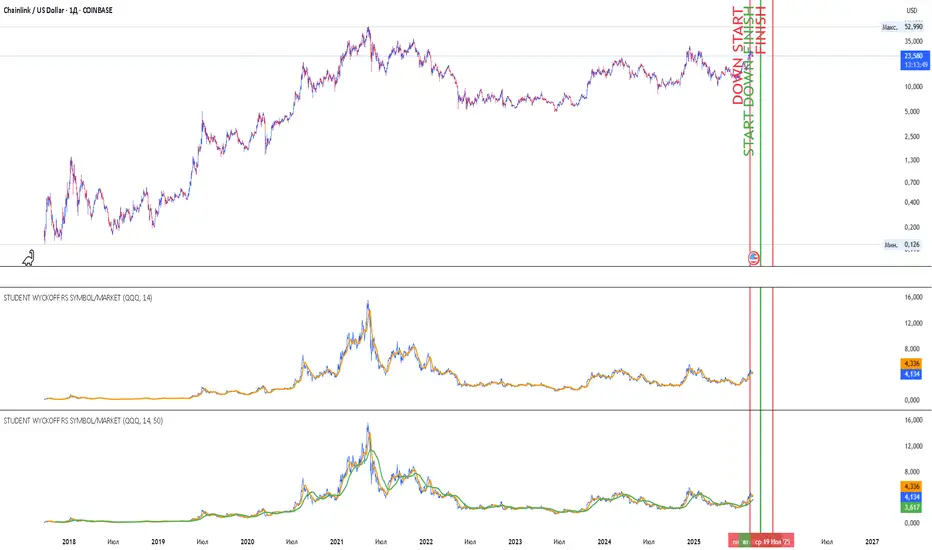
Student Wyckoff RS Symbol/MarketRelative Strength Indicator STUDENT WYCKOFF RS SYMBOL/MARKET
Description
The Relative Strength (RS) Indicator compares the price performance of the current financial instrument (e.g., a stock) against another instrument (e.g., an index or another stock). It is calculated by dividing the closing price of the first instrument by the closing price of the second, then multiplying by 100. This provides a percentage ratio that shows how one instrument outperforms or underperforms another. The indicator helps traders identify strong or weak assets, spot market leaders, or evaluate an asset’s performance relative to a benchmark.
Key Features
Relative Strength Calculation: Divides the closing price of the current instrument by the closing price of the second instrument and multiplies by 100 to express the ratio as a percentage.
Simple Moving Average (SMA): Applies a customizable Simple Moving Average (default period: 14) to smooth the data and highlight trends.
Visualization: Displays the Relative Strength as a blue line, the SMA as an orange line, and colors bars (blue for rising, red for falling) to indicate changes in relative strength.
Flexibility: Allows users to select the second instrument via an input field and adjust the SMA period.
Applications
Market Comparison: Assess whether a stock is outperforming an index (e.g., S&P 500 or MOEX) to identify strong assets for investment.
Sector Analysis: Compare stocks within a sector or against a sector ETF to pinpoint leaders.
Trend Analysis: Use the rise or fall of the RS line and its SMA to gauge the strength of an asset’s trend relative to another instrument.
Trade Timing: Bar coloring helps quickly identify changes in relative strength, aiding short-term trading decisions.
Interpretation
Rising RS: Indicates the first instrument is outperforming the second (e.g., a stock growing faster than an index).
Falling RS: Suggests the first instrument is underperforming.
SMA as a Trend Filter: If the RS line is above the SMA, it may signal strengthening performance; if below, weakening performance.
Settings
Instrument 2: Ticker of the second instrument (default: QQQ).
SMA Period: Period for the Simple Moving Average (default: 14).
Notes
The indicator works on any timeframe but requires accurate ticker input for the second instrument.
Ensure data for both instruments is available on the selected timeframe for precise analysis.
Quad RSRelative Strength (RS) is an Indicator which measures a Stock's performance as compared to a Benchmark Index or another Stock.
For example: RS will tell you whether “A” is increasing more or less than “B” in any market condition. It is one of the tools which is best suited for Momentum Investing.
How RS can be used as a Momentum Indicator:
RS is used in identifying both the strongest and the weakest stock, or any asset class, within the market. Usually, the stocks which display strong or weak RS over a given time period tend to continue to move in the same direction.
How to calculate Relative Strength:
Divide change of "A" over some time period by the change of a particular index/stock "B" over the same time period.
This indicator oscillates around zero. If the value is greater than zero, "A" has been relatively strong compared to "B", during the selected period; if the value is less than zero, "A" has been relatively weak.
Configuration & Default settings:
The Relative symbol can be Input, default is Nifty50.
Time frame can be set, I recommend setting to Day. Default time frame is set to same as chart.
Four different periods can be set. Default values are 500, 250, 125 & 63. If time frame is set as 'Day', these numbers correspond to 2 years, 1 year, 1/2 year & 1 quarter.
Example chart: NiftyMidCap100 with Quad RS indicator with Nifty50 used as Relative Symbol, Four periods: 500, 250, 125 & 63

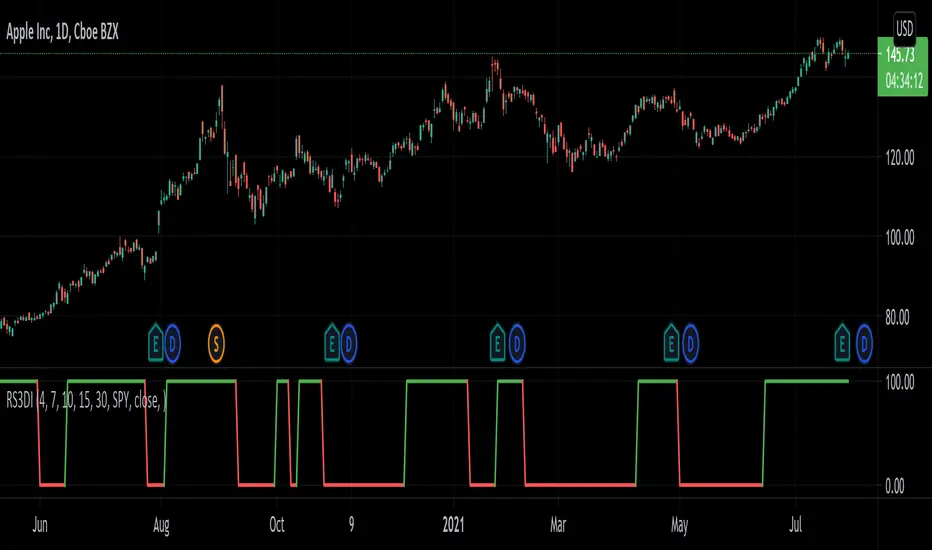
Relative Strength 3D Indicator [CC]This is a custom indicator of mine loosely based on the work by James Garofallou (Stocks and Commodities Sep 2020 pg 14) and this is meant for medium to long term trend confirmations. The idea behind this indicator is to capture 3 different dimensions of trend strength. The first dimension captures the overall strength of the underlying stock vs the market (in this case the S&P 500). The second dimension captures the overall trend strength by assigning a scoring system so when all faster moving averages are stronger than slower moving averages then it gets the max points. The final dimension is the strength of the overall strength of everything so far. Buy when the indicator line turns green and sell when it turns red.
Let me know if there are any other indicators or scripts you would like to see me publish!
Fuerza Relativa vs SPY con TablaRelative Strength vs SPY with Score (0–100)
This indicator measures the relative strength of an asset versus SPY (or any user-defined benchmark), allowing traders to quickly identify whether an asset is outperforming or underperforming the broader market.
Relative strength is calculated as the ratio between the asset’s price and the reference index price, and is accompanied by a smoothed moving average that acts as a baseline to detect changes in relative trend.
🔹 Main Features:
Relative Strength Line:
Green when the asset shows strength versus the market.
Red when it shows relative weakness.
Configurable moving average used as a dynamic reference line.
Colored cloud between the relative strength line and its moving average for quick visual interpretation.
Crossover signals (triangles) when relative strength crosses above its moving average.
🔹 Relative Strength Score (0–100)
Includes an information table displaying a normalized score based on Percent Rank, comparing the current value with its historical behavior:
Current
Previous Day
Previous Week
Previous Month
Score interpretation:
🟢 > 70 → Strong relative performance
🟠 30 – 70 → Neutral zone
🔴 < 30 → Relative weakness
🔹 Recommended Uses:
Identifying market leaders.
Trend confirmation.
Comparative analysis between assets.
Strength-based filters for swing and medium-term trading strategies.

RSI + MA, LinReg, ZZ (HH HL LH LL), Div, Ichi, MACD and TSI HistRelative Strength Index with Moving Average, Linear Regression, Zig Zag (Highs and Lows), Divergence, Ichimoku Cloud, Moving Average Convergence Divergence and True Strength Index Histogram
This script is based on zdmre's RSI script, I revamped a lot of things and added a few indicators from ParkF's RSI script.
Disable Labels in the Style tab and the histogram if you don't enlarge the indicator and it seems too small.
Look to buy in the oversold area and bounce of the support of the linear regression.
Look to sell in the overbought area and bounce of the resistance of the linear regression.
Look for retracement to the moving average or horizontal lines, and divergences for potential reversal.
RSI
The Relative Strength Index (RSI) is a well versed momentum based oscillator which is used to measure the speed (velocity) as well as the change (magnitude) of directional price movements.
Moving Average
Moving Average (MA) is a good way to gauge momentum as well as to confirm trends, and define areas of support and resistance.
Linear Regression
The Linear Regression indicator visualizes the general price trend of a specific part of the chart based on the Linear Regression calculation.
Zig Zag (Highs and Lows)
The Zig Zag indicator is used to identify price trends, and in doing so plots points on the chart to mark whenever prices reverse by a larger percentage point than a predetermined variable or marker.
Divergence
The divergence indicator warns traders and technical analysts of changes in a price trend, oftentimes that it is weakening or changing direction.
Ichimoku Cloud
The Ichimoku Cloud is a package of multiple technical indicators that signal support, resistance, market trend, and market momentum.
MACD and TSI Histogram
MACD can be used to identify aspects of a security's overall trend.
The True Strength Index indicator is a momentum oscillator designed to detect, confirm or visualize the strength of a trend.

Volume RSIRelative strength index based on volume data.
Indicate volume momentum, and help you define divergences on volume.
The goal is to have an idea and represent in another form volumes and kept eyes on volume momentum on a certain period.
RSI is an indicator about the strength, I keep the oversold/overbought thresholds. I think it still makes sense to interpret.
the calculations is simple, we use the average volume up (avg_vol_up) and average volume down (avg_vol_down) over the period.
then calculate the relatives strength : ( avg_vol_up / ( avg_vol_up + avg_vol_down ) ) * 100
The period is 14 by default. The period is used for calculating mean.
I also add MA it helps to have a global look on the indicator.
In my code I used the idea of @Padronhosnai in his code "positve/negative volume" to get volumes in the right form.
For pictures I also use his indicator it's the one above.

Relative Strength Comparison_FBMSCAPShows the strength of current symbol relative to strength of another symbol, defaulted to Bursa Malaysia broad market index: FBMSCAP. Best viewed in weekly chart.

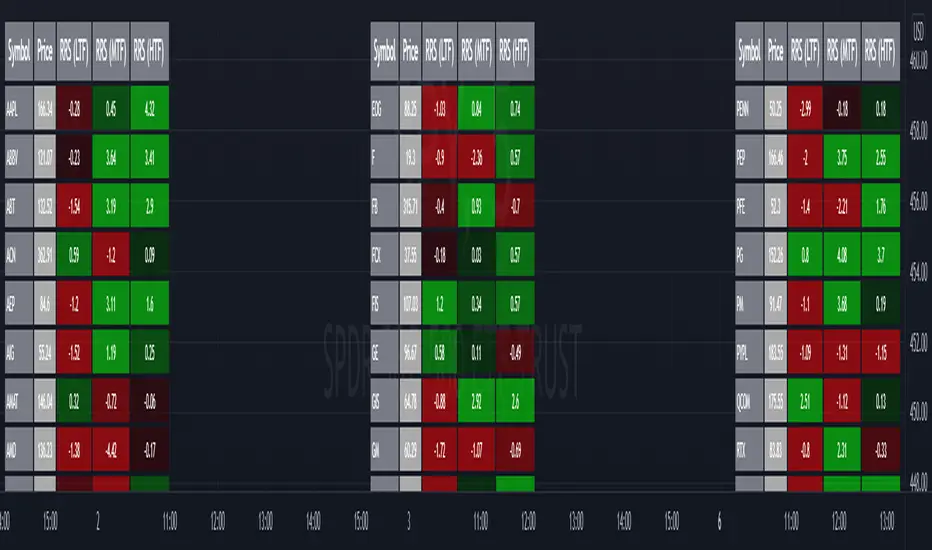
Relative Strength Screener V2 - Top 100 volume leadersNew and improved strength heatmap for the top 100 volume leaders in the S&P. Coded in a workaround to the 40 request.security limitation that currently exists in Pine. Added the ability to input the number of columns (time frames) you wish to display.
For 3 time frame analysis, add the indicator to your chart 3 times. Change the number of columns to 3 for each of these indicators. Specify the column and time frame for each one (example, 5 minute for column 1, 1 hour for column 2 and Daily chart for column 3). It will automatically resize the columns/tables to properly display the output. This provides a sort of "Strength Heatmap" for the top 100 stocks in the S&P. To achieve this, make a copy of the indicator and substitute lines 68-105 with the following premade watchlists :
Make a copy 1 - FIrst 38 volume leaders in the S&P
s01 = input.symbol('AAPL', group = 'Symbols', inline = 's01')
s02 = input.symbol('ABBV', group = 'Symbols', inline = 's02')
s03 = input.symbol('ABT', group = 'Symbols', inline = 's03')
s04 = input.symbol('ACN', group = 'Symbols', inline = 's04')
s05 = input.symbol('AEP', group = 'Symbols', inline = 's05')
s06 = input.symbol('AIG', group = 'Symbols', inline = 's06')
s07 = input.symbol('AMAT', group = 'Symbols', inline = 's07')
s08 = input.symbol('AMD', group = 'Symbols', inline = 's08')
s09 = input.symbol('APA', group = 'Symbols', inline = 's09')
s10 = input.symbol('ATVI', group = 'Symbols', inline = 's10')
s11 = input.symbol('AXP', group = 'Symbols', inline = 's11')
s12 = input.symbol('BA', group = 'Symbols', inline = 's12')
s13 = input.symbol('BBWI', group = 'Symbols', inline = 's13')
s14 = input.symbol('BBY', group = 'Symbols', inline = 's14')
s15 = input.symbol('BK', group = 'Symbols', inline = 's15')
s16 = input.symbol('BMY', group = 'Symbols', inline = 's16')
s17 = input.symbol('BRK.B', group = 'Symbols', inline = 's17')
s18 = input.symbol('C', group = 'Symbols', inline = 's18')
s19 = input.symbol('CAT', group = 'Symbols', inline = 's19')
s20 = input.symbol('CCL', group = 'Symbols', inline = 's20')
s21 = input.symbol('CFG', group = 'Symbols', inline = 's21')
s22 = input.symbol('CL', group = 'Symbols', inline = 's22')
s23 = input.symbol('CNC', group = 'Symbols', inline = 's23')
s24 = input.symbol('COF', group = 'Symbols', inline = 's24')
s25 = input.symbol('COP', group = 'Symbols', inline = 's25')
s26 = input.symbol('COST', group = 'Symbols', inline = 's26')
s27 = input.symbol('CRM', group = 'Symbols', inline = 's27')
s28 = input.symbol('CVS', group = 'Symbols', inline = 's28')
s29 = input.symbol('CVX', group = 'Symbols', inline = 's29')
s30 = input.symbol('DAL', group = 'Symbols', inline = 's30')
s31 = input.symbol('DIS', group = 'Symbols', inline = 's31')
s32 = input.symbol('DISCA', group = 'Symbols', inline = 's32')
s33 = input.symbol('DISCK', group = 'Symbols', inline = 's33')
s34 = input.symbol('DISH', group = 'Symbols', inline = 's34')
s35 = input.symbol('DLTR', group = 'Symbols', inline = 's35')
s36 = input.symbol('DOW', group = 'Symbols', inline = 's36')
s37 = input.symbol('DVN', group = 'Symbols', inline = 's37')
s38 = input.symbol('EBAY', group = 'Symbols', inline = 's38')
Make a copy 2 - Tickers 39 to 76
s01 = input.symbol('EOG', group = 'Symbols', inline = 's01')
s02 = input.symbol('F', group = 'Symbols', inline = 's02')
s03 = input.symbol('FB', group = 'Symbols', inline = 's03')
s04 = input.symbol('FCX', group = 'Symbols', inline = 's04')
s05 = input.symbol('FIS', group = 'Symbols', inline = 's05')
s06 = input.symbol('GE', group = 'Symbols', inline = 's06')
s07 = input.symbol('GIS', group = 'Symbols', inline = 's07')
s08 = input.symbol('GM', group = 'Symbols', inline = 's08')
s09 = input.symbol('GS', group = 'Symbols', inline = 's09')
s10 = input.symbol('HD', group = 'Symbols', inline = 's10')
s11 = input.symbol('IBM', group = 'Symbols', inline = 's11')
s12 = input.symbol('INTC', group = 'Symbols', inline = 's12')
s13 = input.symbol('JNJ', group = 'Symbols', inline = 's13')
s14 = input.symbol('JPM', group = 'Symbols', inline = 's14')
s15 = input.symbol('KR', group = 'Symbols', inline = 's15')
s16 = input.symbol('LUV', group = 'Symbols', inline = 's16')
s17 = input.symbol('LVS', group = 'Symbols', inline = 's17')
s18 = input.symbol('MA', group = 'Symbols', inline = 's18')
s19 = input.symbol('MCD', group = 'Symbols', inline = 's19')
s20 = input.symbol('MCHP', group = 'Symbols', inline = 's20')
s21 = input.symbol('MDT', group = 'Symbols', inline = 's21')
s22 = input.symbol('MET', group = 'Symbols', inline = 's22')
s23 = input.symbol('MGM', group = 'Symbols', inline = 's23')
s24 = input.symbol('MOS', group = 'Symbols', inline = 's24')
s25 = input.symbol('MPC', group = 'Symbols', inline = 's25')
s26 = input.symbol('MRK', group = 'Symbols', inline = 's26')
s27 = input.symbol('MRNA', group = 'Symbols', inline = 's27')
s28 = input.symbol('MS', group = 'Symbols', inline = 's28')
s29 = input.symbol('MSFT', group = 'Symbols', inline = 's29')
s30 = input.symbol('MU', group = 'Symbols', inline = 's30')
s31 = input.symbol('NCLH', group = 'Symbols', inline = 's31')
s32 = input.symbol('NEE', group = 'Symbols', inline = 's32')
s33 = input.symbol('NEM', group = 'Symbols', inline = 's33')
s34 = input.symbol('NFLX', group = 'Symbols', inline = 's34')
s35 = input.symbol('NKE', group = 'Symbols', inline = 's35')
s36 = input.symbol('NVDA', group = 'Symbols', inline = 's36')
s37 = input.symbol('ORCL', group = 'Symbols', inline = 's37')
s38 = input.symbol('OXY', group = 'Symbols', inline = 's38')
Make a copy 3 - tickers 77 to 114
s01 = input.symbol('PENN', group = 'Symbols', inline = 's01')
s02 = input.symbol('PEP', group = 'Symbols', inline = 's02')
s03 = input.symbol('PFE', group = 'Symbols', inline = 's03')
s04 = input.symbol('PG', group = 'Symbols', inline = 's04')
s05 = input.symbol('PM', group = 'Symbols', inline = 's05')
s06 = input.symbol('PYPL', group = 'Symbols', inline = 's06')
s07 = input.symbol('QCOM', group = 'Symbols', inline = 's07')
s08 = input.symbol('RTX', group = 'Symbols', inline = 's08')
s09 = input.symbol('SBUX', group = 'Symbols', inline = 's09')
s10 = input.symbol('SCHW', group = 'Symbols', inline = 's10')
s11 = input.symbol('SLB', group = 'Symbols', inline = 's11')
s12 = input.symbol('SYF', group = 'Symbols', inline = 's12')
s13 = input.symbol('T', group = 'Symbols', inline = 's13')
s14 = input.symbol('TFC', group = 'Symbols', inline = 's14')
s15 = input.symbol('TGT', group = 'Symbols', inline = 's15')
s16 = input.symbol('TJX', group = 'Symbols', inline = 's16')
s17 = input.symbol('TMUS', group = 'Symbols', inline = 's17')
s18 = input.symbol('TSLA', group = 'Symbols', inline = 's18')
s19 = input.symbol('TWTR', group = 'Symbols', inline = 's19')
s20 = input.symbol('TXN', group = 'Symbols', inline = 's20')
s21 = input.symbol('UAL', group = 'Symbols', inline = 's21')
s22 = input.symbol('UNH', group = 'Symbols', inline = 's22')
s23 = input.symbol('V', group = 'Symbols', inline = 's23')
s24 = input.symbol('VIAC', group = 'Symbols', inline = 's24')
s25 = input.symbol('WBA', group = 'Symbols', inline = 's25')
s26 = input.symbol('WFC', group = 'Symbols', inline = 's26')
s27 = input.symbol('WMT', group = 'Symbols', inline = 's27')
s28 = input.symbol('WYNN', group = 'Symbols', inline = 's28')
s29 = input.symbol('XOM', group = 'Symbols', inline = 's29')
s30 = input.symbol('SPY', group = 'Symbols', inline = 's30')
s31 = input.symbol('SPY', group = 'Symbols', inline = 's31')
s32 = input.symbol('SPY', group = 'Symbols', inline = 's32')
s33 = input.symbol('SPY', group = 'Symbols', inline = 's33')
s34 = input.symbol('SPY', group = 'Symbols', inline = 's34')
s35 = input.symbol('SPY', group = 'Symbols', inline = 's35')
s36 = input.symbol('SPY', group = 'Symbols', inline = 's36')
s37 = input.symbol('SPY', group = 'Symbols', inline = 's37')
s38 = input.symbol('SPY', group = 'Symbols', inline = 's38')
RSI true swingsRelative Strength Index (RSI) is being used by majority of the traders to get benefitted based on the swings. But these swings are hard to Identify.
This Indicator uses 4 major factors for finding the potential reversal points:
RSI Crossover or crossunder
Relative volume
Overall volume against the moving average volume
Relative closing of the candles
Size of the bars
Please read Instructions carefully before using this indicator
Recommended entry is the OHLC4 of the signal bars.
If signal bar is too large, try to enter in the retracement when another signal comes either through indicator or through types of bars
when signals comes opposite to the trend, then try to wait for the next signal of same type. This creates a RSI-price divergence in confirmation by volume price action
Timeframe can be of your choice
Recommended stoploss should be swing highs or lows

Relative strength DivergenceThe following indicator uses relative comparison of two assets by the formula n/s3, where n is the t asset on the screen while s3 the underlying assets it is being compared to. The usefulness of the indicator is to primarily compare the assets being traded like BTC (most prominent crypto with largest market cap), with some other crypto like TRX(this has a relatively smaller market cap). Since we get a broader market view through relative comparison of the two assets, the most important function is to find the edge through divergences. Just like RSI the divergences rules would be the same and most important trades would be trades in the direction of the trend along accompanies by divergences that are in line with the trend. Simple divergences work for the best trades with default settings. Although BTCUSD is the default asset to compare with it can be switched with any other asset as well, but it is very much preferred that one uses some type of index as the base asset for comparison. Other than that for simple trading the trend MA crossover can also be used as a signal for simple trend following.

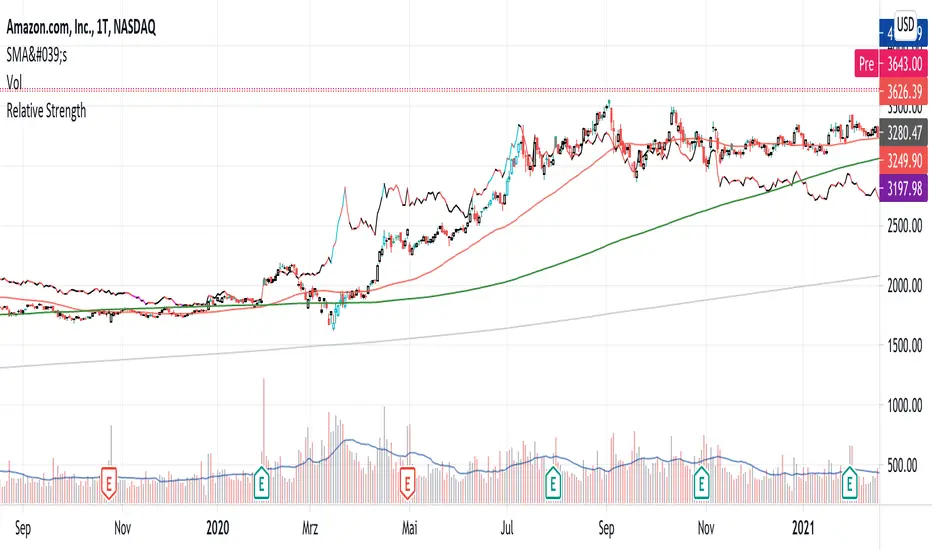
Relative StrengthPowerful tool to calculate and display the strength of a security compared to another security.
Some Main purposes are:
- finding new leadership in a market correction
- comparing a market leader with a top competitor
- tracking rotation in the market
.. and so much more!
This tool is highly configurable, you can especially change:
- The reference symbol (SPY, QQQ, BTCUSD, ...)
- The time span to indicate a new High or Low in a certain time-frame
- Factorize your RS-Chart to make it fit to the original chart. (Moves the chart up or down)
- Option to repaint your candles / bars when a new RS High occurs in the given timeframe.
Enjoy and have a great day!
Powerful_Trading
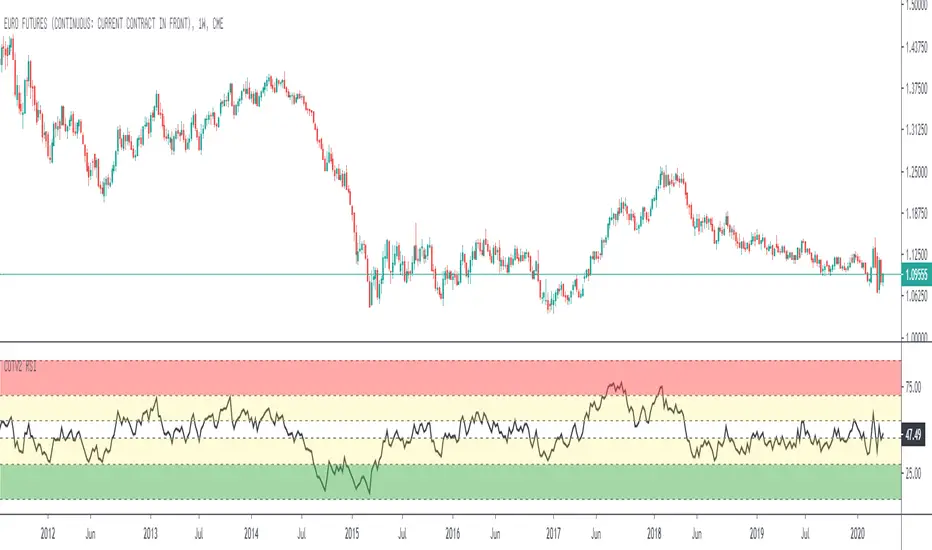
Relative Strength Index for COT System V2Standard Relative Strenght Indicator with coloured value areas. The red area shows a strong overbought level, what can be used as an warning signal for a trend reversal into downtrend.
The green area shows a strong oversold level, what can be used as an warning signal for a trend reversal into uptrend. The yellow areas are only warning areas.
relative strength to BTCIt compares how much the asset has gone up or down in % more or less relative to BTC % increments.
It can also be converted into an oscillator

Relative Strength to MarketPlots the relative performance of a stock to a chosen market (default: SP500) as a sliding window average over three different time periods (50, 100 & 200 candles)

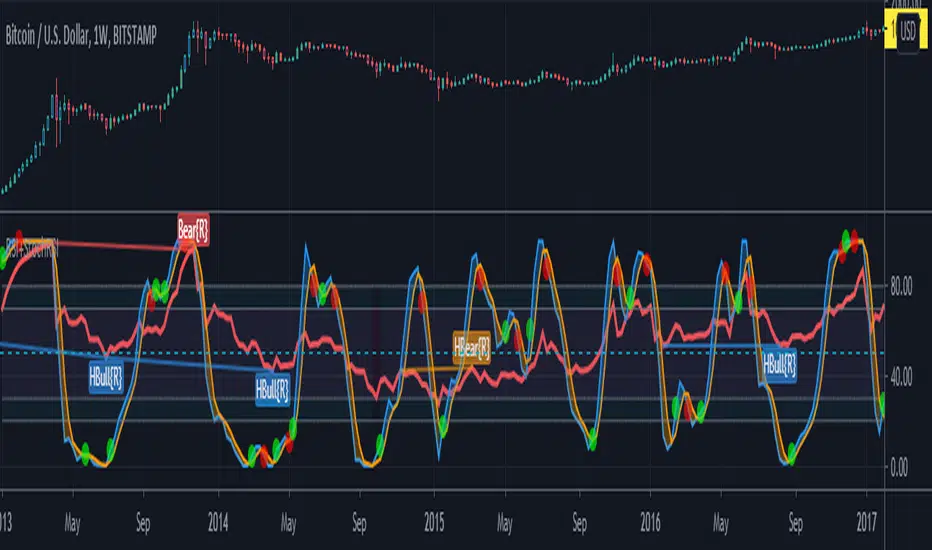
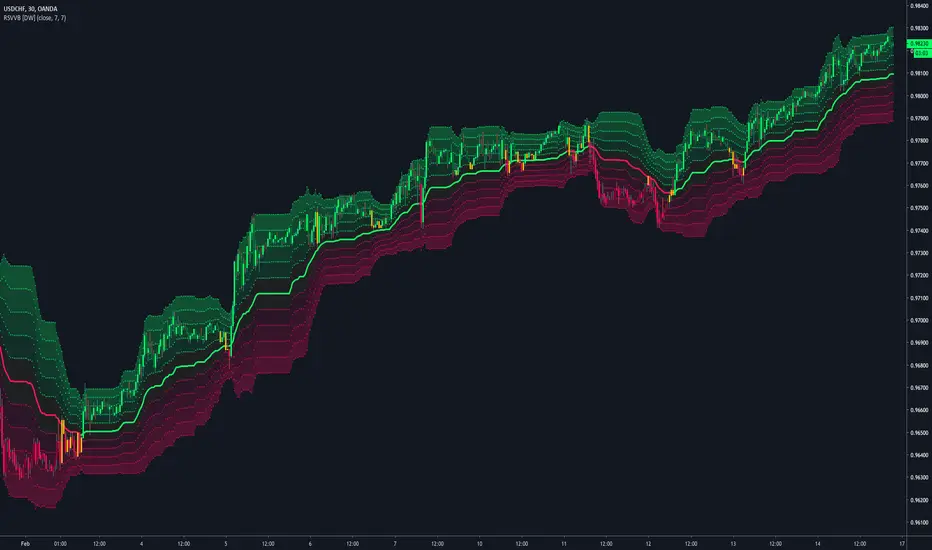
Relative Strength Volatility Variable Bands [DW]This is an experimental adaptive trend following study inspired by Giorgos Siligardos's Reverse Engineering RSI and Tushar S. Chande's Variable Moving Average.
In this study, reverse engineered RSI levels are calculated and used to generate a volatility index for VMA calculation.
First, price levels are calculated for when RSI will equal 70 and 30. The difference between the levels is taken and normalized to create the volatility index.
Next, an initial VMA is calculated using the created volatility index. The moving average is an exponential calculation that adjusts the sampling length as volatility changes.
Then, upper and lower VMAs are calculated by taking a VMA of prices above and below the initial VMA. The midline is produced by taking the median of the upper and lower VMAs.
Lastly, the band levels are calculated by multiplying the distance from the midline to the upper and lower VMAs by 1, 2, 3, 4, and 5.
Bar colors are included. They're based on the midline trend and price action relative to the upper and lower VMAs.

Relative Strength Index, Divergences, color and more lines.Modified RSI technical indicator with divergences. Additional colors and more lines have been added.

Relative Strength Index - More Lines, Color and Divergence.Modified RSI technical indicator with divergences. Additional colors and more lines have been added.Enjoy.

RSI Dual-Source DashboardRelative Strength Index
Table with adjustable positions
Shows:
RSI, 14 Source High (on given TF)
RSI, 14 Source Low (on given TF)

Relative Strength Index_YJ//@version=5
indicator(title="MACD_YJ", shorttitle="MACD_YJ",format=format.price, precision=2)
source = close
useCurrentRes = input.bool(true, title="Use Current Chart Resolution?")
resCustom = input.timeframe("60", title="Use Different Timeframe? Uncheck Box Above")
smd = input.bool(true, title="Show MacD & Signal Line? Also Turn Off Dots Below")
sd = input.bool(false, title="Show Dots When MacD Crosses Signal Line?")
sh = input.bool(true, title="Show Histogram?")
macd_colorChange = input.bool(true, title="Change MacD Line Color-Signal Line Cross?")
hist_colorChange = input.bool(true, title="MacD Histogram 4 Colors?")
// === Divergence inputs ===
grpDiv = "Divergence"
calculateDivergence = input.bool(true, title="Calculate Divergence", group=grpDiv, tooltip="피벗 기반 정/역배 다이버전스 탐지 및 알람 사용")
lookbackRight = input.int(5, "Lookback Right", group=grpDiv, minval=1)
lookbackLeft = input.int(5, "Lookback Left", group=grpDiv, minval=1)
rangeUpper = input.int(60, "Bars Range Upper", group=grpDiv, minval=1)
rangeLower = input.int(5, "Bars Range Lower", group=grpDiv, minval=1)
bullColor = input.color(color.new(#4CAF50, 0), "Bull Color", group=grpDiv)
bearColor = input.color(color.new(#F23645, 0), "Bear Color", group=grpDiv)
textColor = color.white
noneColor = color.new(color.white, 100)
res = useCurrentRes ? timeframe.period : resCustom
fastLength = input.int(12, minval=1)
slowLength = input.int(26, minval=1)
signalLength= input.int(9, minval=1)
fastMA = ta.ema(source, fastLength)
slowMA = ta.ema(source, slowLength)
macd = fastMA - slowMA
signal = ta.sma(macd, signalLength)
hist = macd - signal
outMacD = request.security(syminfo.tickerid, res, macd)
outSignal = request.security(syminfo.tickerid, res, signal)
outHist = request.security(syminfo.tickerid, res, hist)
// 가격도 같은 res로
hi_res = request.security(syminfo.tickerid, res, high)
lo_res = request.security(syminfo.tickerid, res, low)
// ── Histogram 색
histA_IsUp = outHist > outHist and outHist > 0
histA_IsDown = outHist < outHist and outHist > 0
histB_IsDown = outHist < outHist and outHist <= 0
histB_IsUp = outHist > outHist and outHist <= 0
macd_IsAbove = outMacD >= outSignal
plot_color = hist_colorChange ? (histA_IsUp ? color.new(#00FF00, 0) :
histA_IsDown ? color.new(#006900, 0) :
histB_IsDown ? color.new(#FF0000, 0) :
histB_IsUp ? color.new(#670000, 0) : color.yellow) : color.gray
macd_color = macd_colorChange ? color.new(#00ffff, 0) : color.new(#00ffff, 0)
signal_color = color.rgb(240, 232, 166)
circleYPosition = outSignal
// 골든/데드 크로스 (경고 해결: 먼저 계산)
isBullCross = ta.crossover(outMacD, outSignal)
isBearCross = ta.crossunder(outMacD, outSignal)
cross_color = isBullCross ? color.new(#00FF00, 0) : isBearCross ? color.new(#FF0000, 0) : na
// ── 플롯
plot(sh and outHist ? outHist : na, title="Histogram", color=plot_color, style=plot.style_histogram, linewidth=5)
plot(smd and outMacD ? outMacD : na, title="MACD", color=macd_color, linewidth=1)
plot(smd and outSignal? outSignal: na, title="Signal Line", color=signal_color, style=plot.style_line, linewidth=1)
plot(sd and (isBullCross or isBearCross) ? circleYPosition : na,
title="Cross", style=plot.style_circles, linewidth=3, color=cross_color)
hline(0, "0 Line", linestyle=hline.style_dotted, color=color.white)
// =====================
// Divergence (정배/역배) - 피벗 비교
// =====================
_inRange(cond) =>
bars = ta.barssince(cond)
rangeLower <= bars and bars <= rangeUpper
plFound = false
phFound = false
bullCond = false
bearCond = false
macdLBR = outMacD
if calculateDivergence
// 정배: 가격 LL, MACD HL
plFound := not na(ta.pivotlow(outMacD, lookbackLeft, lookbackRight))
macdHL = macdLBR > ta.valuewhen(plFound, macdLBR, 1) and _inRange(plFound )
lowLBR = lo_res
priceLL = lowLBR < ta.valuewhen(plFound, lowLBR, 1)
bullCond := priceLL and macdHL and plFound
// 역배: 가격 HH, MACD LH
phFound := not na(ta.pivothigh(outMacD, lookbackLeft, lookbackRight))
macdLH = macdLBR < ta.valuewhen(phFound, macdLBR, 1) and _inRange(phFound )
highLBR = hi_res
priceHH = highLBR > ta.valuewhen(phFound, highLBR, 1)
bearCond := priceHH and macdLH and phFound
// 시각화 (editable 파라미터 삭제)
plot(plFound ? macdLBR : na, offset=-lookbackRight, title="Regular Bullish (MACD)",
linewidth=2, color=(bullCond ? bullColor : noneColor), display=display.pane)
plotshape(bullCond ? macdLBR : na, offset=-lookbackRight, title="Bullish Label",
text=" Bull ", style=shape.labelup, location=location.absolute, color=bullColor, textcolor=textColor, display=display.pane)
plot(phFound ? macdLBR : na, offset=-lookbackRight, title="Regular Bearish (MACD)",
linewidth=2, color=(bearCond ? bearColor : noneColor), display=display.pane)
plotshape(bearCond ? macdLBR : na, offset=-lookbackRight, title="Bearish Label",
text=" Bear ", style=shape.labeldown, location=location.absolute, color=bearColor, textcolor=textColor, display=display.pane)
// 알람
alertcondition(bullCond, title="MACD Regular Bullish Divergence",
message="MACD 정배 다이버전스 발견: 현재 봉에서 lookbackRight 만큼 좌측.")
alertcondition(bearCond, title="MACD Regular Bearish Divergence",
message="MACD 역배 다이버전스 발견: 현재 봉에서 lookbackRight 만큼 좌측.")
